
Reciprocal Runway Operations (RRO) and RRO Noise Abatement Procedure (NAP) Report

WSI is expected to use RRO (aircraft depart to the south-west and arrive from the south-west) as its preferred runway mode between 11pm and 5.30am. For RRO to be used, all the following conditions must be met:

  • Tailwinds (including gusts), must not exceed 5 knots (approximately 9km/hour)
  • The runway surface must be dry, including free of dew or fog
  • Low traffic levels – due to the opposing-direction movements of aircraft. For safety reasons, a departing aircraft cannot take off if an arriving aircraft is within 20 nautical miles (approximately 37km) of the airport. If traffic levels increase, ATC will switch to using Runway 23 or Runway 05

When RRO is in use, a NAP for RRO has also been developed to further minimise these impacts by tactically directing aircraft off the designated flight paths and around communities when lower traffic volumes allow. The following conditions, in addition to the RRO conditions listed above, must be met for RRO-NAP to be used:

  • Due to opposing-direction movements of aircraft, RRO NAP can only be applied when arriving aircraft are more than 30 nautical miles, approximately 56km from WSI. If traffic levels increase, ATC will switch to using RRO, Runway 23 or Runway 05

More information about RRO and RRO-NAP can be found in the RRO factsheet.

As per the ministerial direction, reporting on RRO and RRO NAP utilisation rates will commence at the end of the first month of commercial passenger flights from WSI. The first report will be available as soon as practicable in early December 2026.
WSI Reciprocal Runway Operations — Weekly Report (SAMPLE)

WSI Reciprocal Runway Operations — Weekly Report (SAMPLE)

Illustrative placeholder data — demonstrates the report generator only

Generated: 27-Aug-2026  |  Timezone: AEST (UTC+10)

Runway mode utilisation

Hours spent in each runway mode across the reporting week. Values below are illustrative placeholders only.

Hours in mode, by runway mode (whole week)
Hours in mode, by runway mode (whole week) Bar chart of hours in each runway mode for the week: Mode 05 sixty-two hours, Mode 23 forty-eight hours, Reciprocal twenty-one hours, Transition seven hours. 0 16 32 48 64 80 Mode 05 Mode 23 Reciprocal Transition Runway mode Hours in mode (h) Hours: 62 h 62 h Hours: 48 h 48 h Hours: 21 h 21 h Hours: 7 h 7 h
Show data table for this chart
Data for Hours in mode, by runway mode (whole week)
Runway modeHours
Mode 0562 h
Mode 2348 h
Reciprocal21 h
Transition7 h
Mode utilisation summary (whole week, illustrative)
Runway modeHours in mode (h)Share of week (%)
Mode 056244.3
Mode 234834.3
Reciprocal2115.0
Transition75.0
Total138100.0

Weather gating

Reciprocal availability against weather gates (tailwind and visibility), by day. Values are illustrative placeholders only.

Reciprocal hours: available vs weather-gated, by day
Reciprocal hours: available vs weather-gated, by day Grouped bar chart comparing available reciprocal hours against weather-gated hours for each day of the week. Illustrative placeholder values. Available (h) Weather-gated (h) 0 1 2 3 4 5 Mon Tue Wed Thu Fri Sat Sun Day of week Hours (h) Available (h): 3.5 3.5 Weather-gated (h): 1 1 Available (h): 4 4 Weather-gated (h): 0.5 0.5 Available (h): 2.5 2.5 Weather-gated (h): 2 2 Available (h): 5 5 Weather-gated (h): 0.5 0.5 Available (h): 3 3 Weather-gated (h): 1.5 1.5 Available (h): 1.5 1.5 Weather-gated (h): 2.5 2.5 Available (h): 1 1 Weather-gated (h): 3 3
Show data table for this chart
Data for Reciprocal hours: available vs weather-gated, by day
Day of weekAvailable (h)Weather-gated (h)
Mon3.51
Tue40.5
Wed2.52
Thu50.5
Fri31.5
Sat1.52.5
Sun13

Transition activity

Count of mode transitions per day across the week. Values are illustrative placeholders only.

Mode transitions per day
Mode transitions per day Line chart of the number of runway mode transitions per day across the week, ranging from two to seven. Illustrative placeholder values. 0 1.6 3.2 4.8 6.4 8 Mon Tue Wed Thu Fri Sat Sun Day of week Transitions (count) Transitions: 4 4 Transitions: 3 3 Transitions: 6 6 Transitions: 2 2 Transitions: 5 5 Transitions: 7 7 Transitions: 3 3
Show data table for this chart
Data for Mode transitions per day
Day of weekTransitions
Mon4
Tue3
Wed6
Thu2
Fri5
Sat7
Sun3
Transition counts and mean transition duration, by day (illustrative)
DayTransitions (count)Mean duration (min)
Mon412.5
Tue310.0
Wed614.2
Thu29.5
Fri511.8
Sat713.0
Sun310.7
Airservices Australia — WSI Reciprocal Runway Operations. This is a SAMPLE report; all values are illustrative placeholders generated for layout and accessibility testing, not operational data.

Preferred Runway Operations

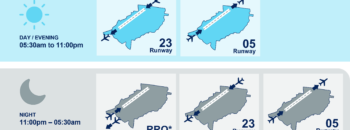
Preferred runways are part of Western Sydney Airport’s Noise Abatement Procedures (NAP). There are different preferred runways during the daytime and overnight period:

During the daytime period (5:30am-11pm):

Priority 1: Arriving and departing Runway 23 (arriving from the north-east and departing to the south-west)

Priority 2: Arriving and departing Runway 05 (arriving from the south-west and departing to the north-east)

During the overnight period (11pm-5:30am):

Priority 1: Reciprocal Runway Operations (RRO) (arriving and departing from the south-west)

Priority 2: Runway 23 (arriving from the north-east and departing to the south-west)

Priority 3: Runway 05 (arriving from the south-west and departing to the north-east)

There will be reporting function that provides the percentage of each operating mode during daytime and night-time periods for each month. The first report will be available as soon as practicable, in early December 2026.

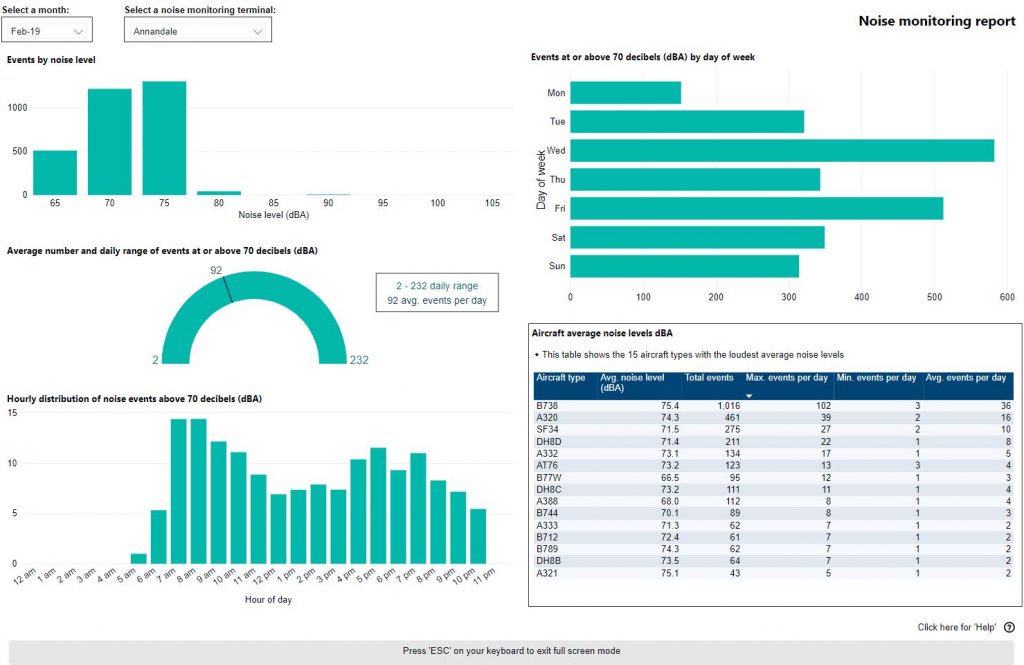
Western Sydney noise monitoring report

As part of the Western Sydney Noise and Flight Path Monitoring System (NFPMS), Airservices monitors noise levels in areas surrounding Western Sydney Airport using 13 noise monitors . We strategically deploy noise monitors at various locations around the Western Sydney region to capture data from aircraft operations in differing phases of flight.

Noise monitor data is publicly available on WebTrak, for community members to see the noise level of aircraft as they pass over the monitors. WebTrak uses official aircraft movement data and is designed as both a flight tracking and noise monitoring tool. To ensure aircraft track information and noise monitoring data are accurately processed and synchronised, the system applies a three-minute delay before information is displayed. This processing period improves data quality and helps minimise gaps that may occur because of communications or data transfer delays. The below interactive tool provides a monthly report for each long-term noise monitor.

Please note that the monthly noise monitoring report includes only aircraft movements associated with Western Sydney Airport (WSI). The accompanying graphs display only WSI-related noise events exceeding 65 dBA.

The tool is best viewed in full screen mode. To familiarise yourself with the tool, we advise that you click on the ‘Click here for Help’ button on the bottom right of the tool before use.

Temporary Noise Monitoring – completion reports

As part of Airservices’ noise monitoring program for WSI, we have four temporary noise monitors, which we are moving around different locations over a five-year period.

During the community engagement program conducted in 2025, community members were invited to submit an expression of interest (EOI) to host a temporary noise monitor on their private property.

All submissions were assessed based on factors such as proximity to the nearest flight path, proximity to a proposed permanent monitor, aircraft altitude over the proposed location, and the relative suitability of other suggested sites. A schedule of the current and upcoming temporary noise monitoring locations is available on the WSI Engage Airservices website.

Reports will be available at the end of each rotation with the first rotation scheduled to conclude in April 2027 (all reports are provided as PDFs).