Learn about flight paths and aircraft movements in your area
Welcome to the Aircraft in Your Neighborhood Portal
Our goal is that you will learn more about the flight paths and aircraft movements in your area and be able to access the information and resources that explain how air traffic is managed.
First, please select your location using one of the following options, so that we can customize the information for your location.
We’ll remember your location so you don’t have to enter it every time you visit the site and we’ll keep this information confidential.
Please note, that this site works best on Chrome, Firefox and Edge.
* Mandatory - Select region first to view the map.
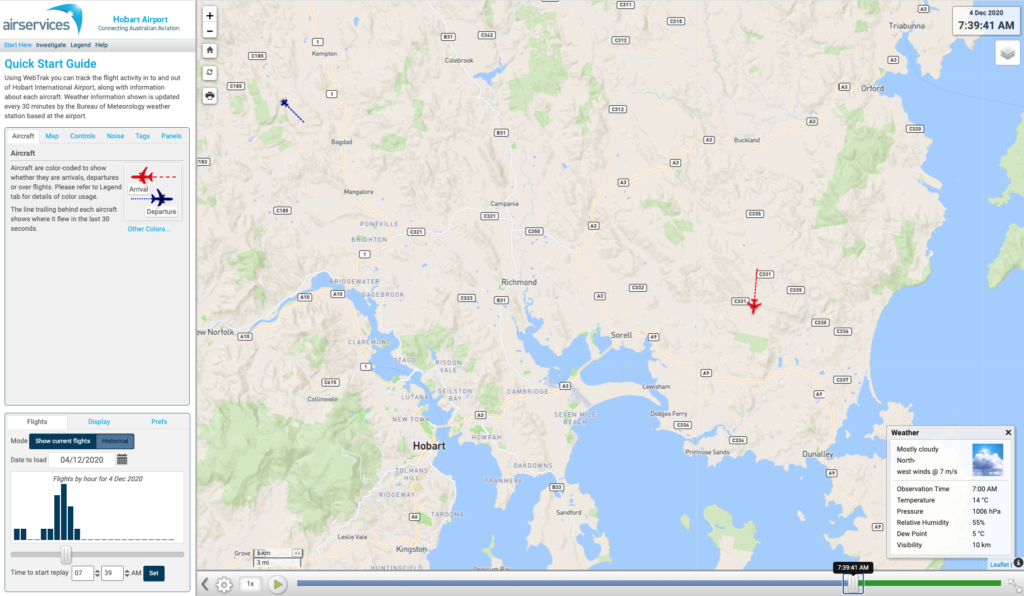
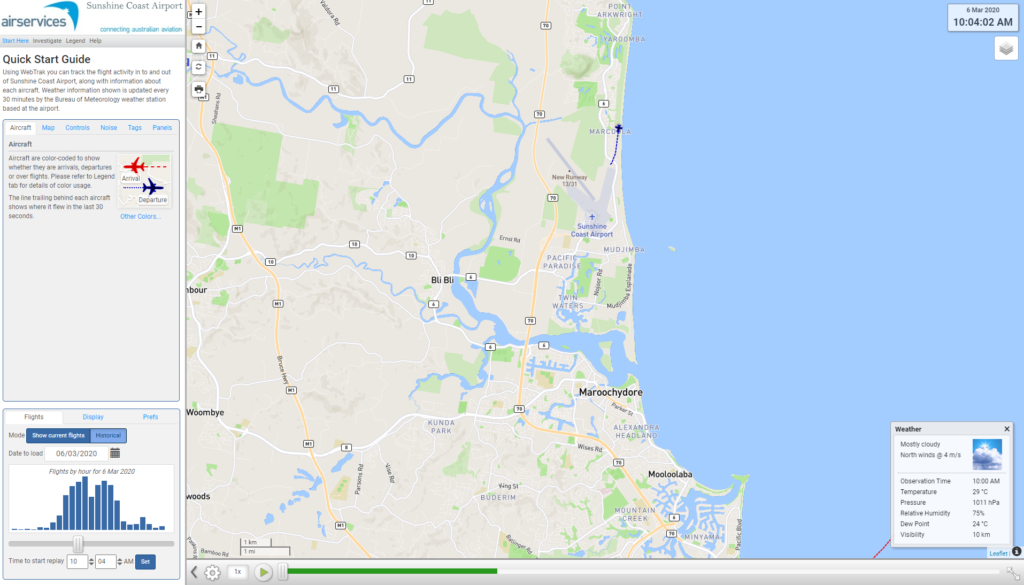
WebTrak is a tool that enables the community to see where aircraft fly and explore historical trends and patterns. WebTrak is provided by Envirosuite.
WebTrak uses information from air traffic control radars to display aircraft movements. The flight search and display function allows you to view aircraft flight activity over metropolitan areas. You can also:
locate your street address and have your home appear on the map
see noise levels of individual aircraft
view information about aircraft type, height, origin and destination
display an aircraft’s flight path and point of closest approach to your home
zoom in and out down to street level.
Note that there is a slight minute delay on the display of flights.
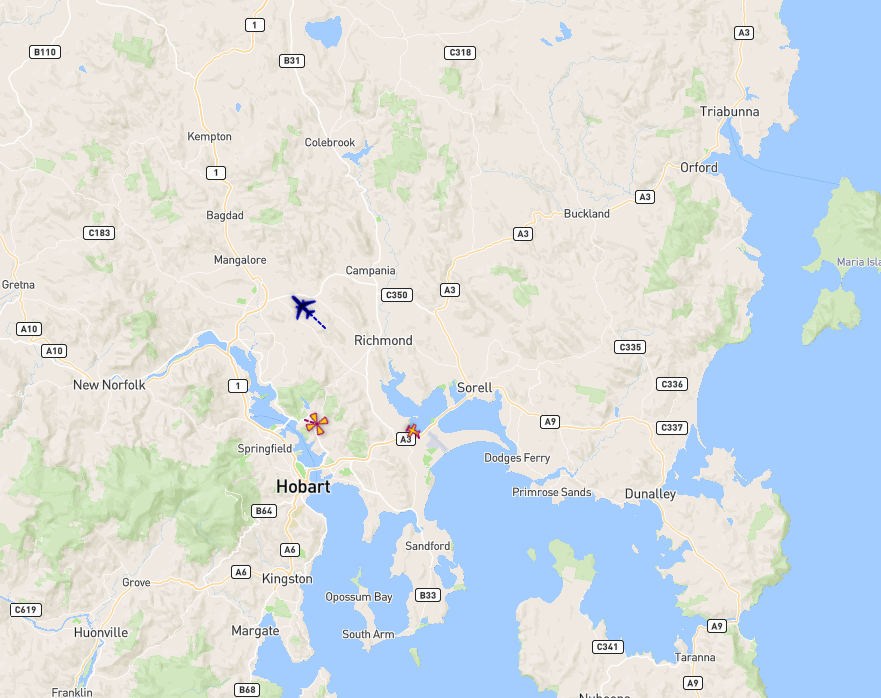
While jet aircraft usually fly on published flight paths, turbo-propeller or turbo-prop aircraft (non-jet) have a range of different performance capabilities and therefore fly in a range of ways.
Some turbo-props fly on the published instrument arrival flight paths, while others use the published visual approaches which includes vectoring from air traffic control (ATC).
Turbo-prop departures are allocated headings by ATC based on their destination. This is to keep them safely separated from jet operations, due to differences in aircraft capability (for example speed and altitude of operations), and to maintain a steady flow of traffic.
This means we see a broad area where turbo-props may fly.
Impact of COVID-19 on aircraft operations
Aircraft are flying in accordance with the published procedures. The impacts of COVID-19 restrictions, and the subsequent reduction in interstate jet traffic movements during border closures, resulted in a different distribution of traffic across flight paths and areas of operation.
This is because air traffic control has not needed to use parallel runway operations due to the lower traffic levels.
This has resulted in a greater spread of turbo props outside of the ’swathe’ of operations than we expected.
Turbo props use a mix of jet and non-jet flight paths including visual approaches. A visual approach is when a pilot is operating the aircraft by visual references. This approach can therefore vary by several kilometres.
Changes to turbo-prop operations
We have worked closely with Brisbane Airport to understand the safety and traffic management requirements during this period of disruption.
We will implement a temporary Noise Abatement Procedure to adjust the traffic spread to match what would have been experienced had COVID-19 not affected traffic volumes. This will increase operations in the areas between the short and long approaches (the swathe) during periods of high demand, while the shorter visual approach will still occur when traffic volumes are generally lower.
This temporary procedure will be in place until operations increase to both runways, which will then result in a similar traffic management outcome – with more aircraft operating within the ‘swathes’.
Turbo props will continue to fly visual approaches after we return to parallel runway operations, generally in non-peak times.
Arrivals
Turbo-props need to be managed to make sure they can safely arrive along with jet operations. When the airport is busier, turbo-props more commonly arrive using the published flight paths so they can be safely separated from the jet aircraft traffic by air traffic control.
As there has been low jet traffic at Brisbane airport, turbo props were able to conduct visual approaches and arrive on a more direct path to the runway from their locations.
With borders opening and traffic levels increasing to the existing runway, more turbo-prop aircraft will be required to fly on the published instrument flight paths as they are processed in parallel with jet traffic to both runways.
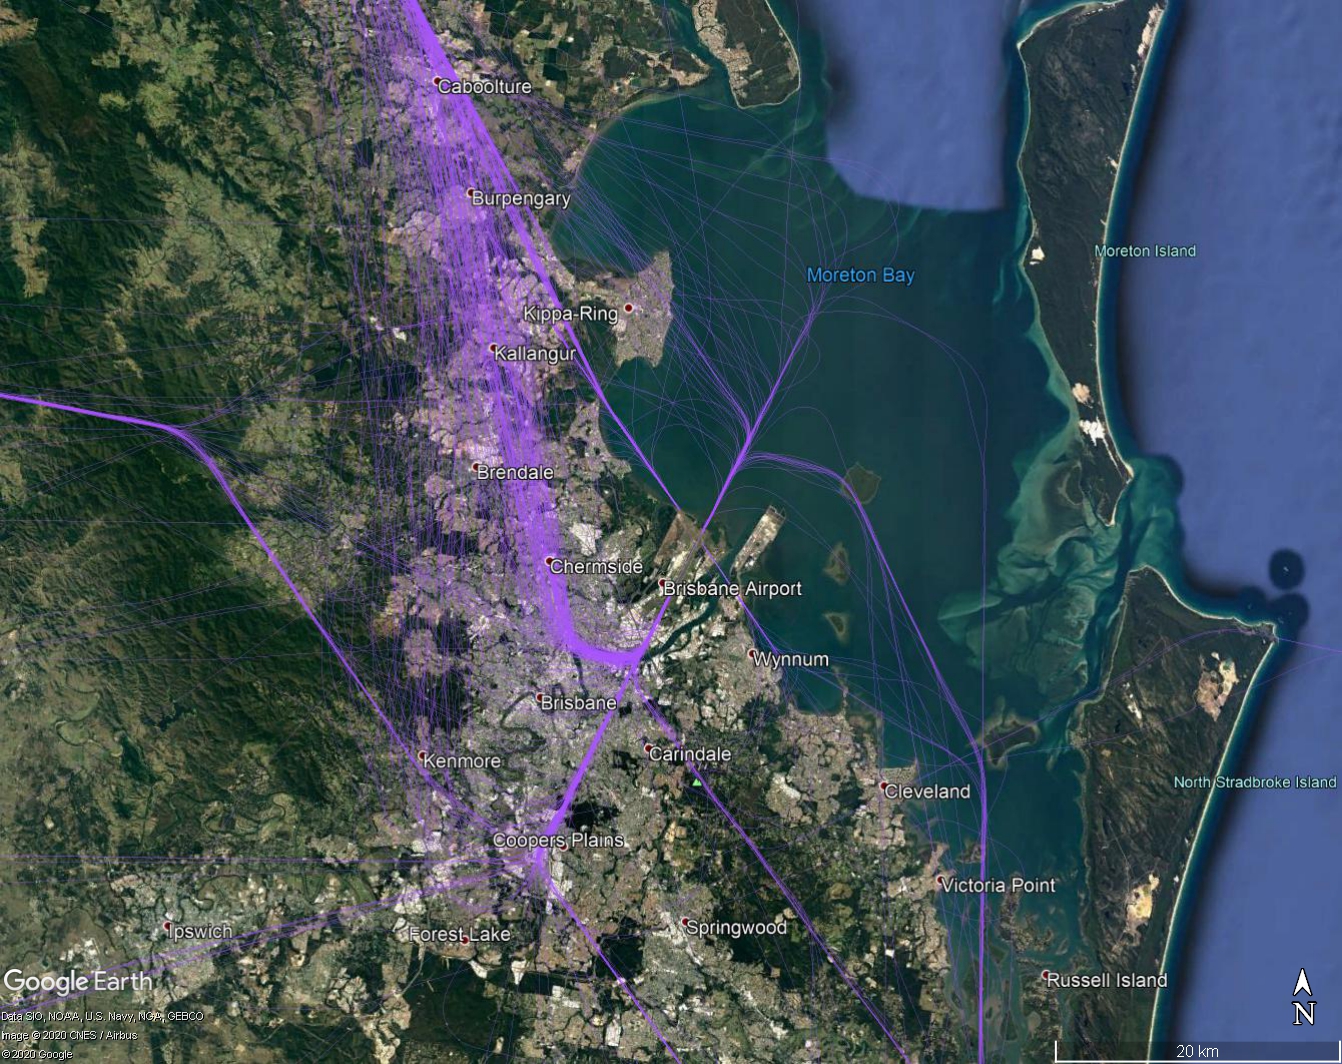
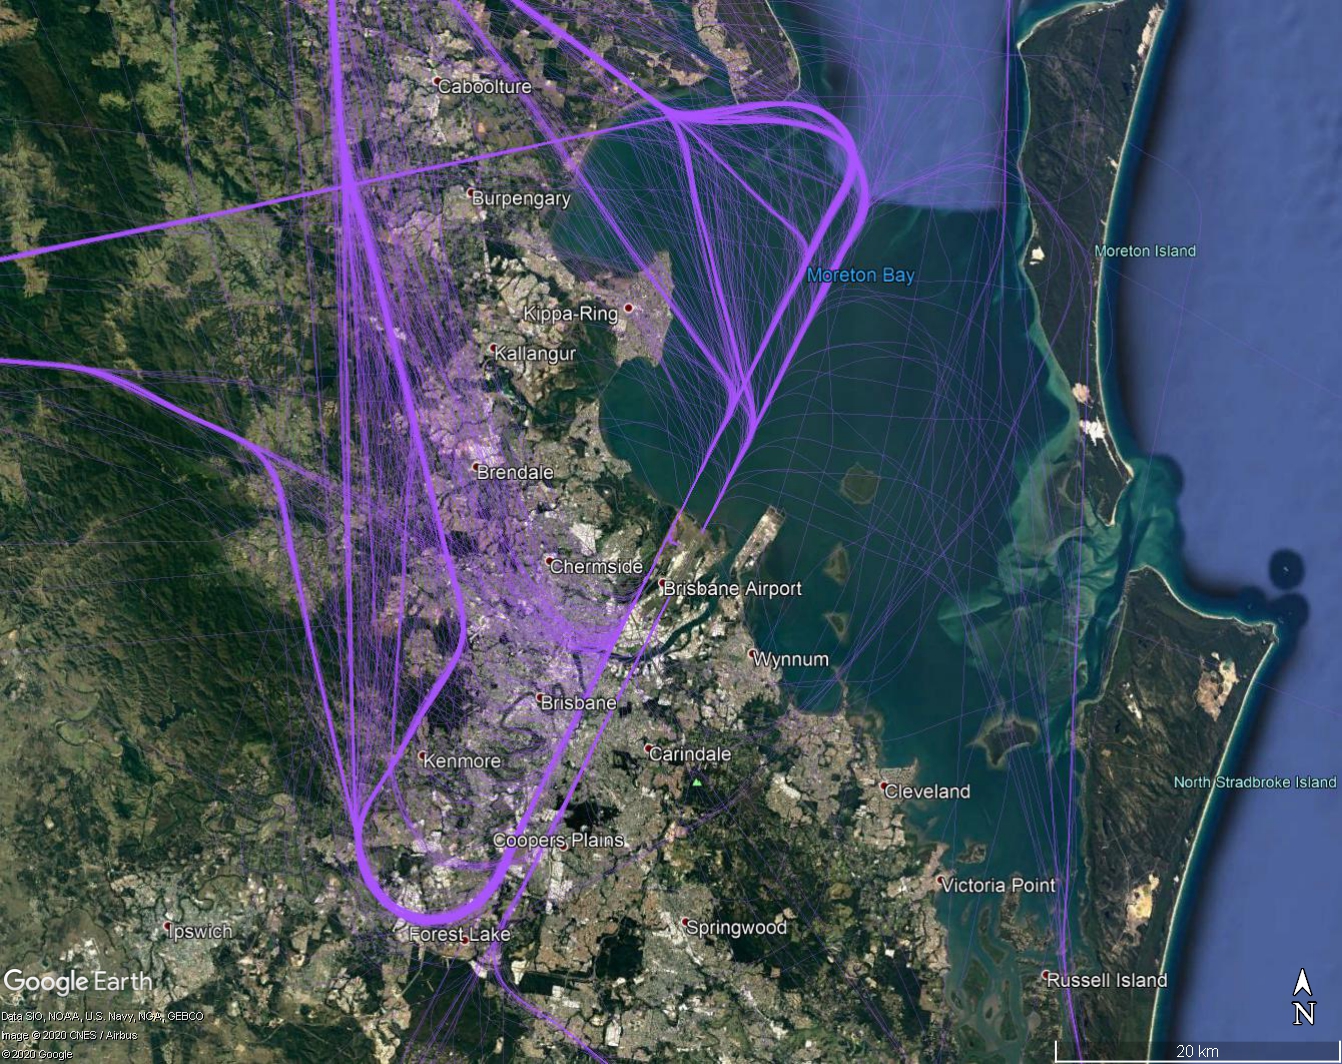
Turbo-prop arrivals to legacy runway (purple) – September 2019
The image above shows pre-COVID levels of turbo-prop arrivals with traffic arriving from both northern and southern locations.
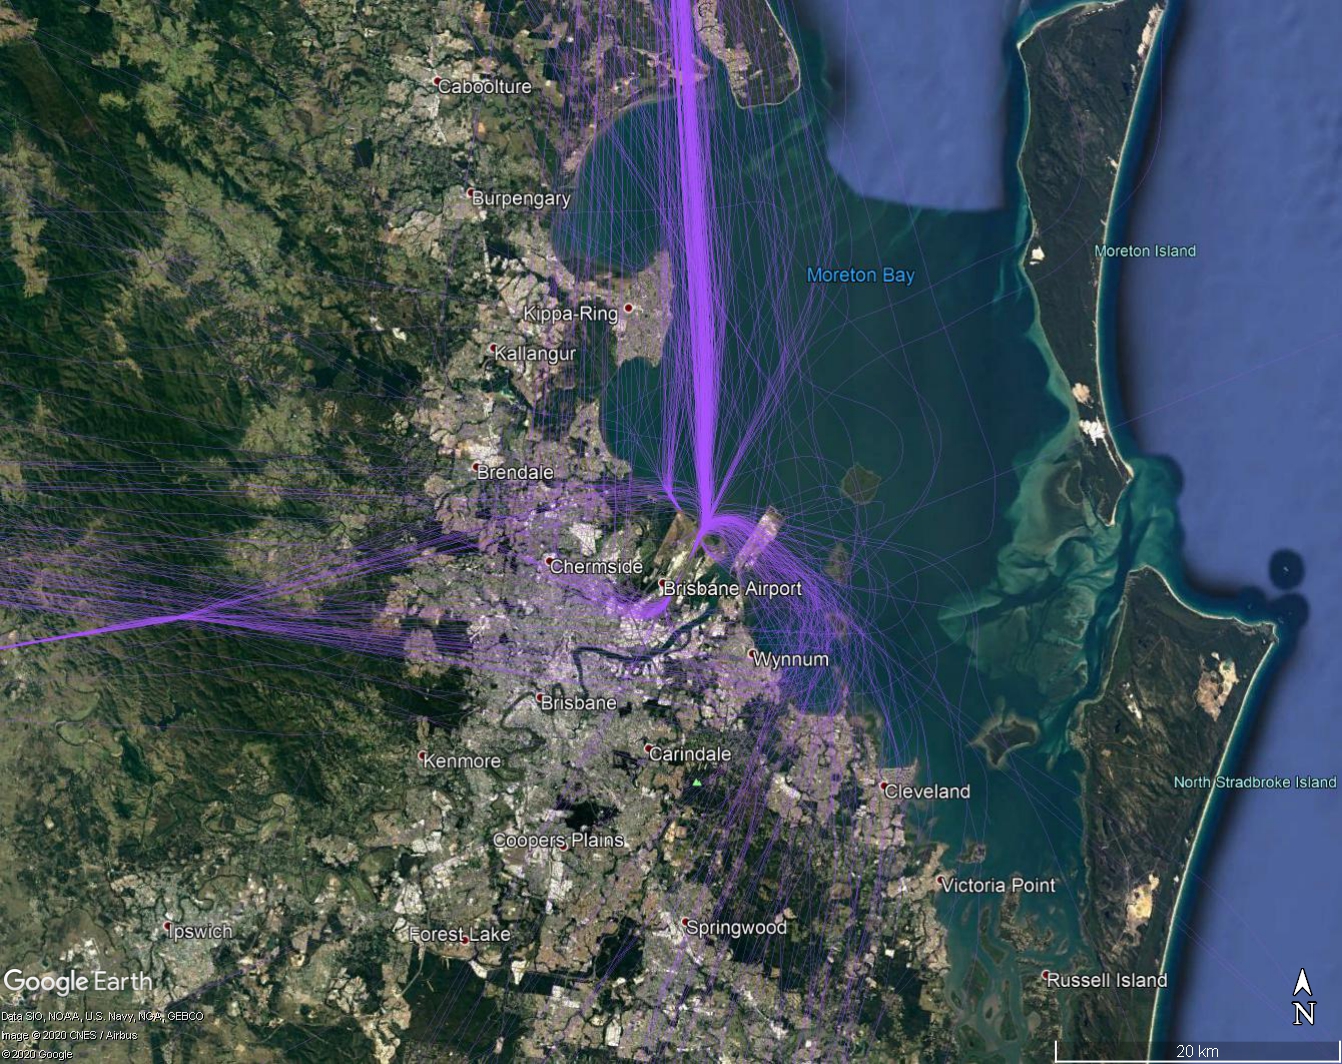
Turbo-prop arrivals to legacy runway and new runway (purple) and – September 2020
The image above shows an overall reduction in turbo-prop arrivals, with the majority of remaining flights arriving from northern (intrastate) locations to the new runway (Runway 19R/01L).
Click on the images above to open a larger view in a new tab.
Departures
Turbo-props are usually assigned a heading at the departure end of the runway, depending on their destination. You will notice that turbo-prop aircraft using the legacy runway at night are quite spread out.
With borders opening and traffic levels increasing to the existing runway, more turbo-prop aircraft will depart from the existing runway.
Turbo-prop departures from legacy runway (purple) – September 2019
The image above shows pre-COVID levels of turbo-prop departures with traffic departing from both northern and southern locations.
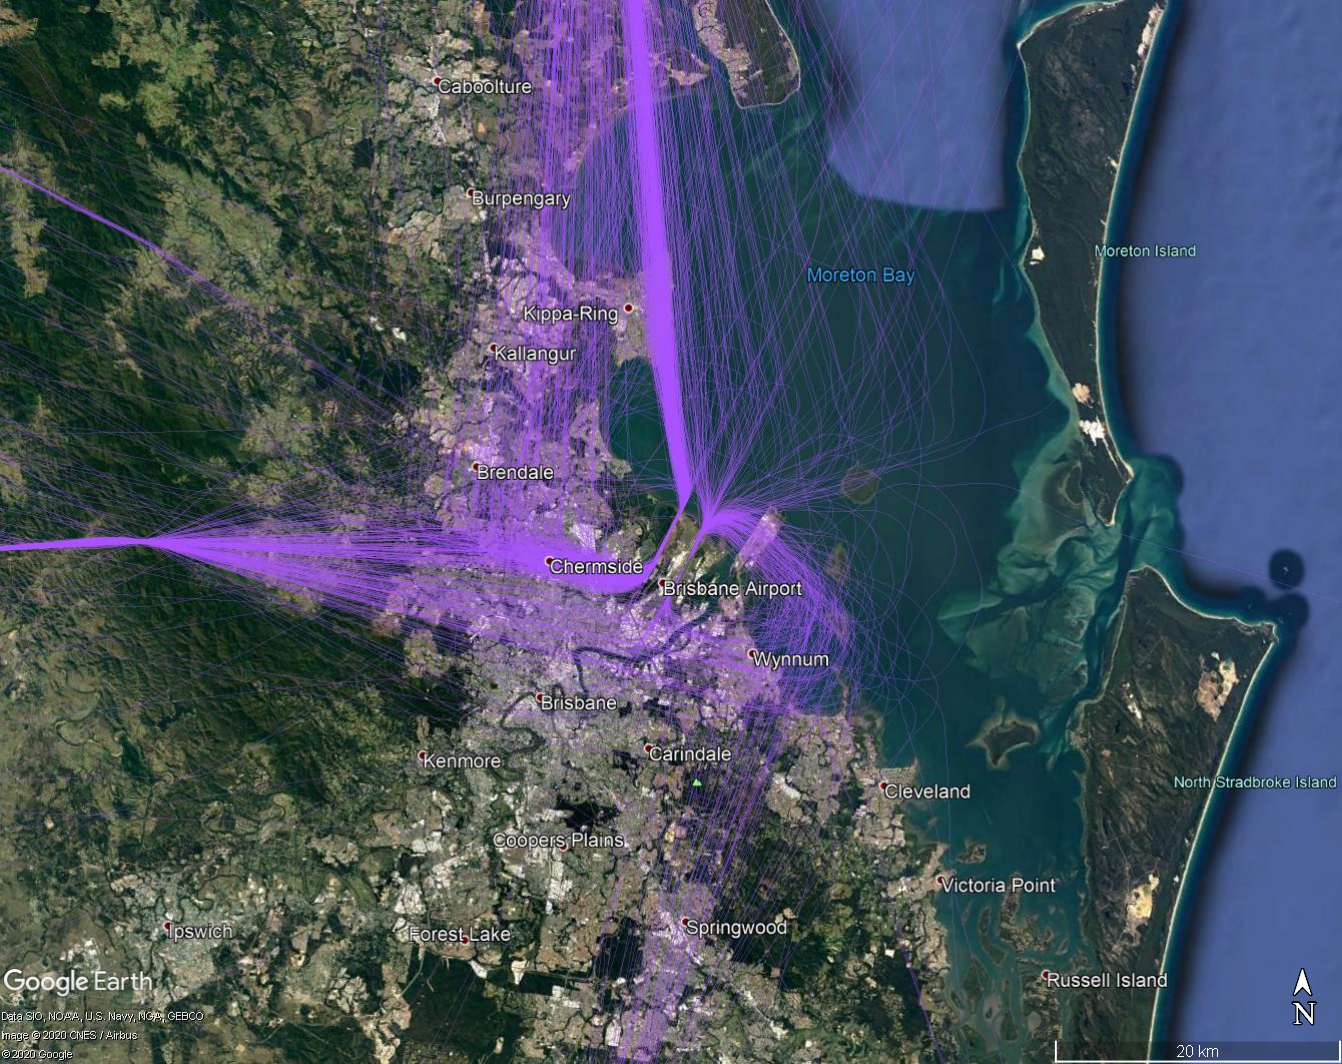
Turbo-prop departures from legacy runway and new runway (purple) – September 2020
The image above shows an overall reduction in turbo-prop departures but a wider spread, with the majority of remaining flights departing to northern (intrastate) locations from the new runway (Runway 19R/01L).
Click on the images above to open a larger view in a new tab.
Note: All tracks during the stated month have been displayed. Track colours have been adjusted to show track density. Where aircraft are more concentrated the colour will appear darker.
Every major airport has Noise Abatement Procedures (NAPs), which are procedures designed to reduce the impact of aircraft noise on the community. There are some limitations to the use of NAPs and they may not be used if they generate delay and congestion, as this can cause noise and emission impacts. Air traffic control or pilots may not be able to use them in certain situations, for example weather conditions or operational requirements.
At Hobart, during tower hours (between 5:50am and 10:10pm) NAPs preference instrument approaches and departures for large aircraft (e.g. jets).
The VHF omnidirectional radio (VOR) is the least preferred instrument option and may only be used for flight training for small aircraft (under 5700 kilograms) or for operational reasons when no alternative approach exists.
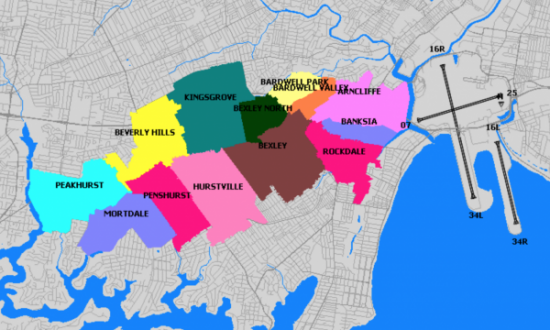
Suburbs to the immediate west of Sydney Airport are affected by aircraft arriving to (“east flow”) and departing from (“west flow”) the east-west runway.
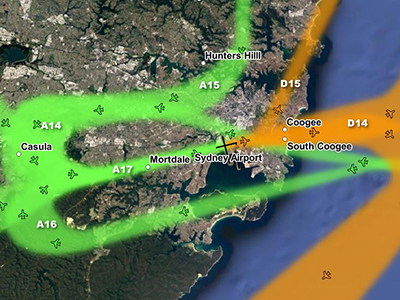
Below: east flow (left) and west flow (right)
Sydney’s seasonal wind patterns mean that you are more likely to experience arrivals in the warmer months and departures in the cooler months. This is because aircraft need to take off and land into the wind. You are also more likely to experience traffic in non-peak periods when the east-west runway is used whenever possible for noise sharing purposes. Non-peak periods are generally:
6:00 – 7:00am,
11:00 – 3:00pm, and
after 8:00pm.
These times may vary, however. There will also be days when the wind conditions make use of the two north-south parallel runways impossible, and on such days you are likely to experience heavy levels of traffic for prolonged periods.
Arrivals – east flow
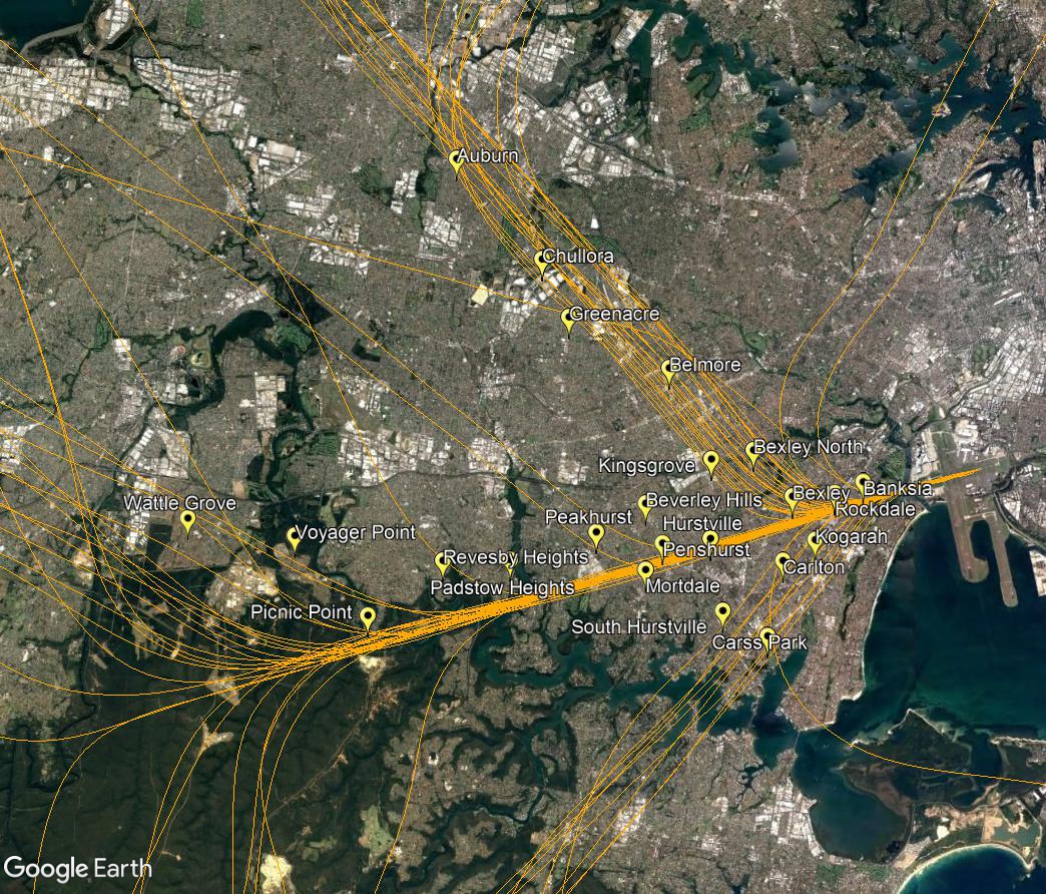
Arriving aircraft must align with the runway from a considerable distance out from the airport, and fly straight in. This means that aircraft arriving to land on the east-west runway will always fly over suburbs such as Picnic Point, Penshurst, Hurstville, Bexley and Rockdale. The following image shows actual tracks of arriving aircraft.
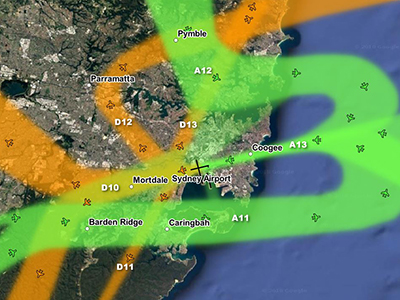
Departures – west flow
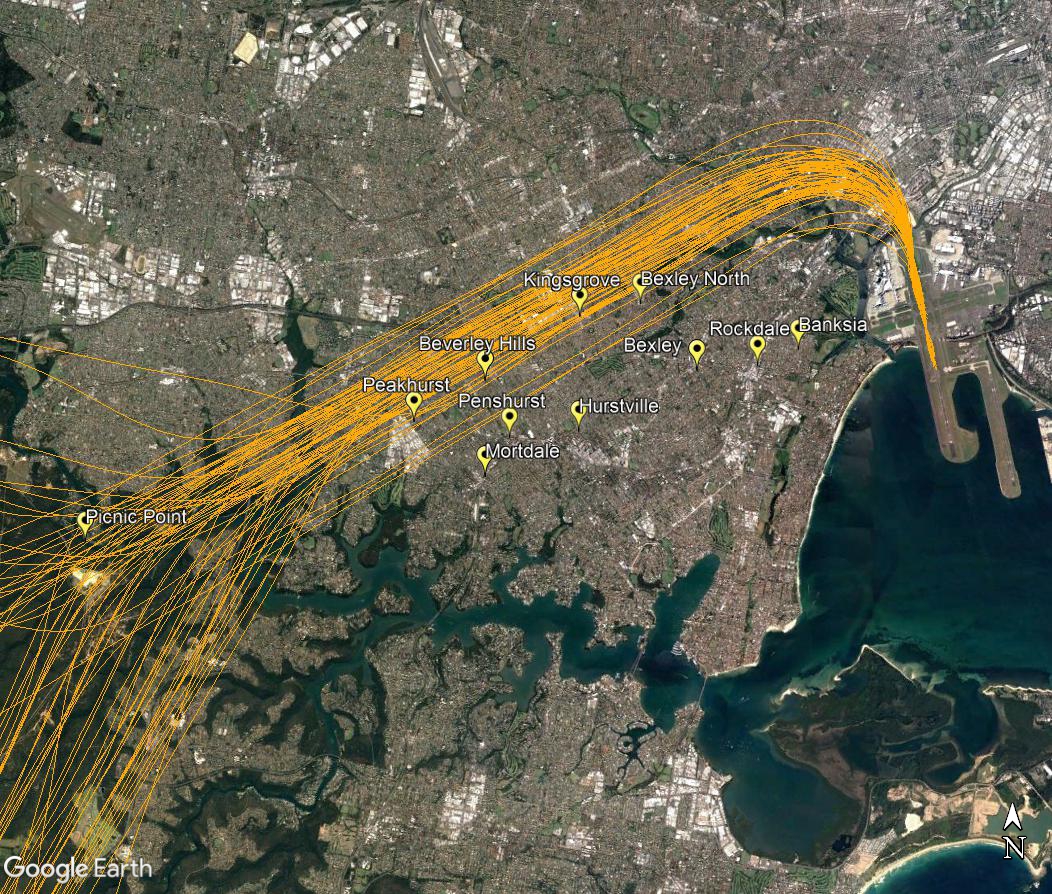
Aircraft departing towards the west will turn to their heading when they reach 1,500 feet (for jets) or 800 feet (for non-jets). As different types of aircraft have different climbing abilities, they will reach this altitude at different points after take-off and therefore begin their turns at different points in the air. This has the effect of creating a spread of aircraft as can be seen in the image below.
If the aircraft is proceeding to destinations to the west such as Perth or south such as Melbourne it will maintain the runway heading for longer before turning.The following image shows actual tracks of departing aircraft.
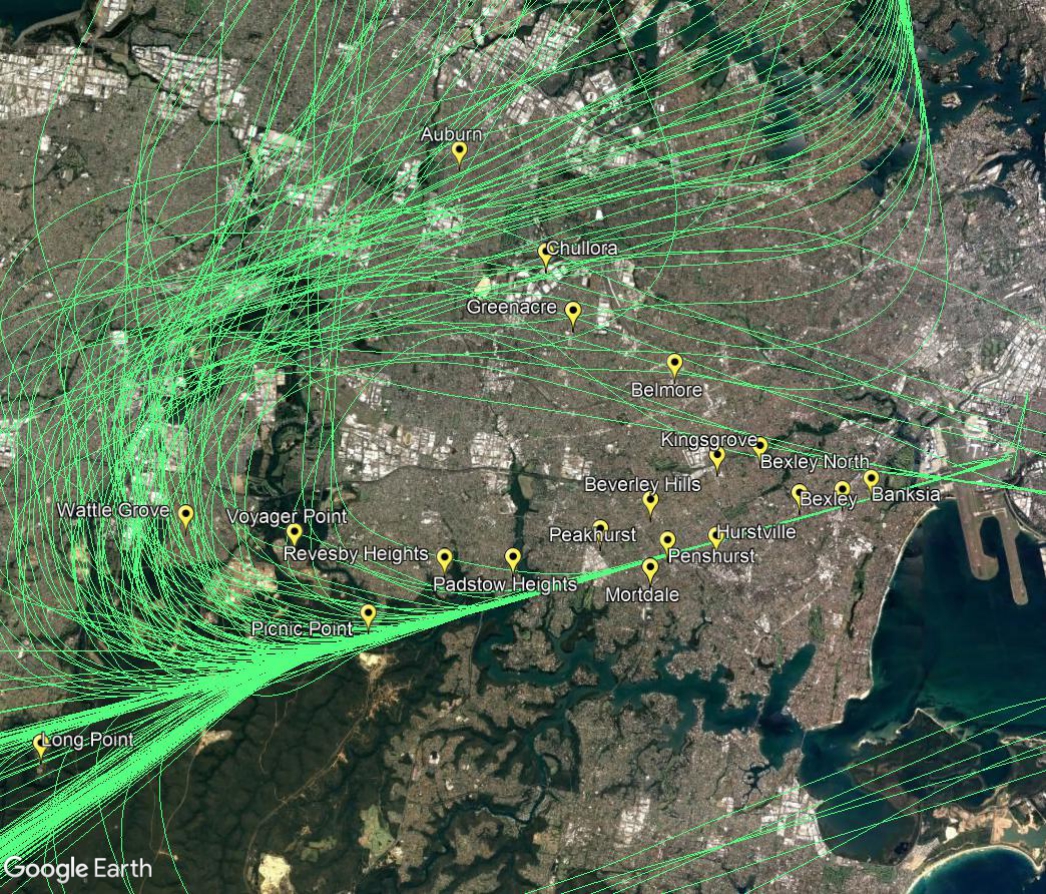
Departures – north flow
When aircraft are departing from the westernmost of the parallel runways, non-jets (turbo-prop aircraft) that are heading for southerly or westerly destinations will turn left after departure when they reach the altitude of 600 feet. This will create a spread of aircraft, taking them over suburbs such as Kingsgrove, Beverley Hills and Peakhurst. This is illustrated in the track image below.
Federally-leased airports (excluding Mt. Isa and Tennant Creek) have established Community Aviation Consultation Groups (CACGs), which provide an effective avenue for local community engagement on airport planning and operations, including aircraft noise. The Department for Infrastructure, Transport, Regional Development and Communications provides guidelines for CACGs.
Non federally-leased airports may also choose to establish CACGs or community forums.
CACG membership depends on the characteristics of the airport and any local issues of community concern however, generally includes:
airport management
aircraft operators
community organisations or representatives
representatives from state, territory or local government bodies
local tourism and business groups.
Airservices does not formally belong to CACGs, but is invited to attend to provide relevant information and assist in discussions. We engage with CACGs on flight path and airspace changes, as well as technical reviews, such as noise monitoring and noise abatement procedures.
WebTrak is a tool that enables the community to see where aircraft fly and explore historical trends and patterns. WebTrak is provided by Envirosuite .
WebTrak uses information from air traffic control radars to display aircraft movements. The flight search and display function allows you to view aircraft flight activity over metropolitan areas. You can also:
locate your street address and have your home appear on the map
see noise levels of individual aircraft
view information about aircraft type, height, origin and destination
display an aircraft’s flight path and point of closest approach to your home
zoom in and out down to street level.
Note that there is a slight delay on the display of flights.
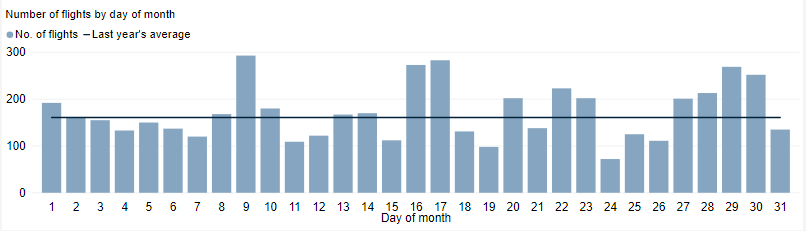
This tool shows the number of flights each day over your area in the selected month compared to the average for last year. The bottom axis shows the day of the month. Use the drop-down menu to change the selected month to see how movements have varied. Hover over each day to see flight numbers.
*Please note due to technical issues between 19 June and 22 June 2024, flight data may not be accurately displayed. Our supplier is working to resolve the issue. We apologise for any inconvenience this may cause.
There are a number of factors that influence the frequency of flights.
Firstly, the number and frequency of flights will vary on a daily, weekly and yearly basis due to differences in airline schedules. The airlines schedule flights in response to consumer demand. This is particularly the case around Christmas, Easter, school holidays and Lunar New Year.
Secondly, the runway in use at any given time will also vary, largely due to the wind conditions. Each runway has its own set of flight paths, and each flight path will affect different areas. As the runway in use changes, the flight paths change, and so too do the areas affected by aircraft movements.
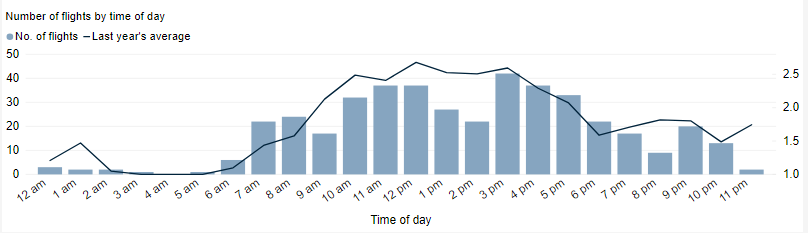
This chart shows the total number of flights each hour over the month, compared to the average for last year. Change the selected month to see how it has varied.
*Please note due to technical issues between 19 June and 22 June 2024, flight data may not be accurately displayed. Our supplier is working to resolve the issue. We apologise for any inconvenience this may cause.
*Please note due to technical issues between 19 June and 22 June 2024, flight data may not be accurately displayed. Our supplier is working to resolve the issue. We apologise for any inconvenience this may cause.
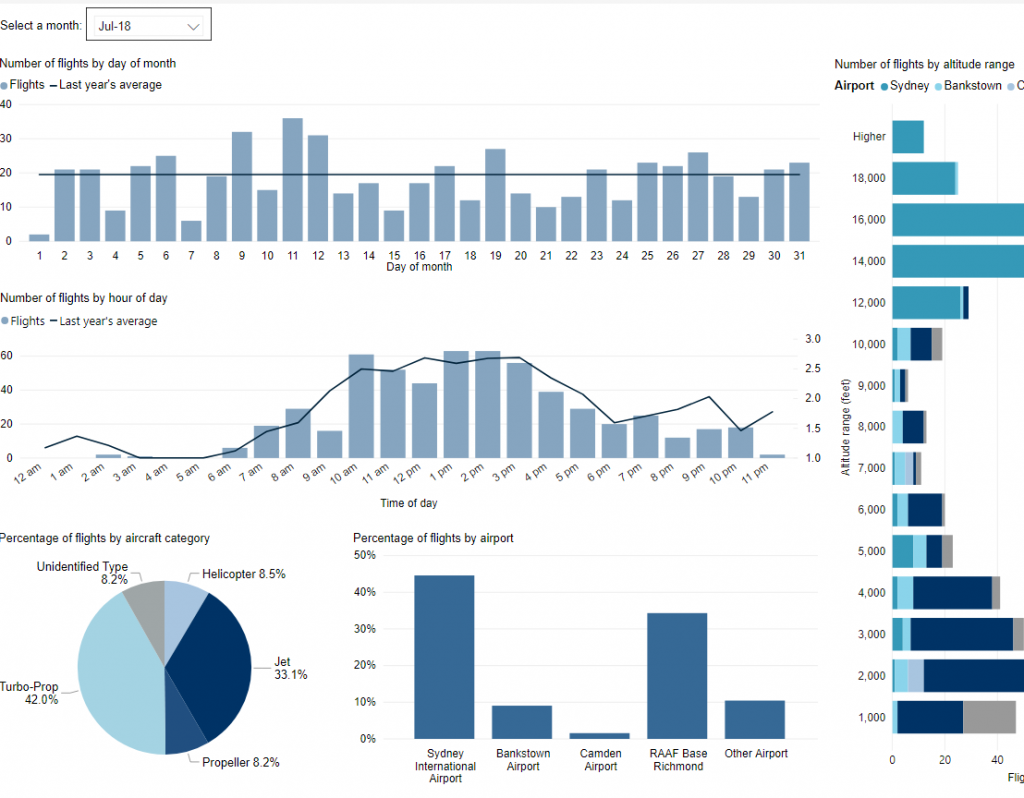
Use this interactive tool to explore detailed data for your area in the month of your choice.
This report is best viewed in full screen mode.
*Please note due to technical issues between 19 June and 22 June 2024, flight data may not be accurately displayed. Our supplier is working to resolve the issue. We apologise for any inconvenience this may cause.